GigaMaps
I lead the UX of the global school connectivity map. Research decides what the map should say, a prototype puts new features in front of users first, and only what holds up goes to production.
- Role
- Product designer, researcher and builder
- Period
- 2025 to today
- Stack
- Next.js 16React 19Tailwind 4MapLibreMapbox GLStorybook 10
I lead the UX of GigaMaps, the map that shows the connectivity of schools around the world. The work runs on three tracks: a research plan that decides what the map should say, a prototype called devmap where new features meet users before anyone builds them, and the product itself, where only what holds up gets shipped.
The context
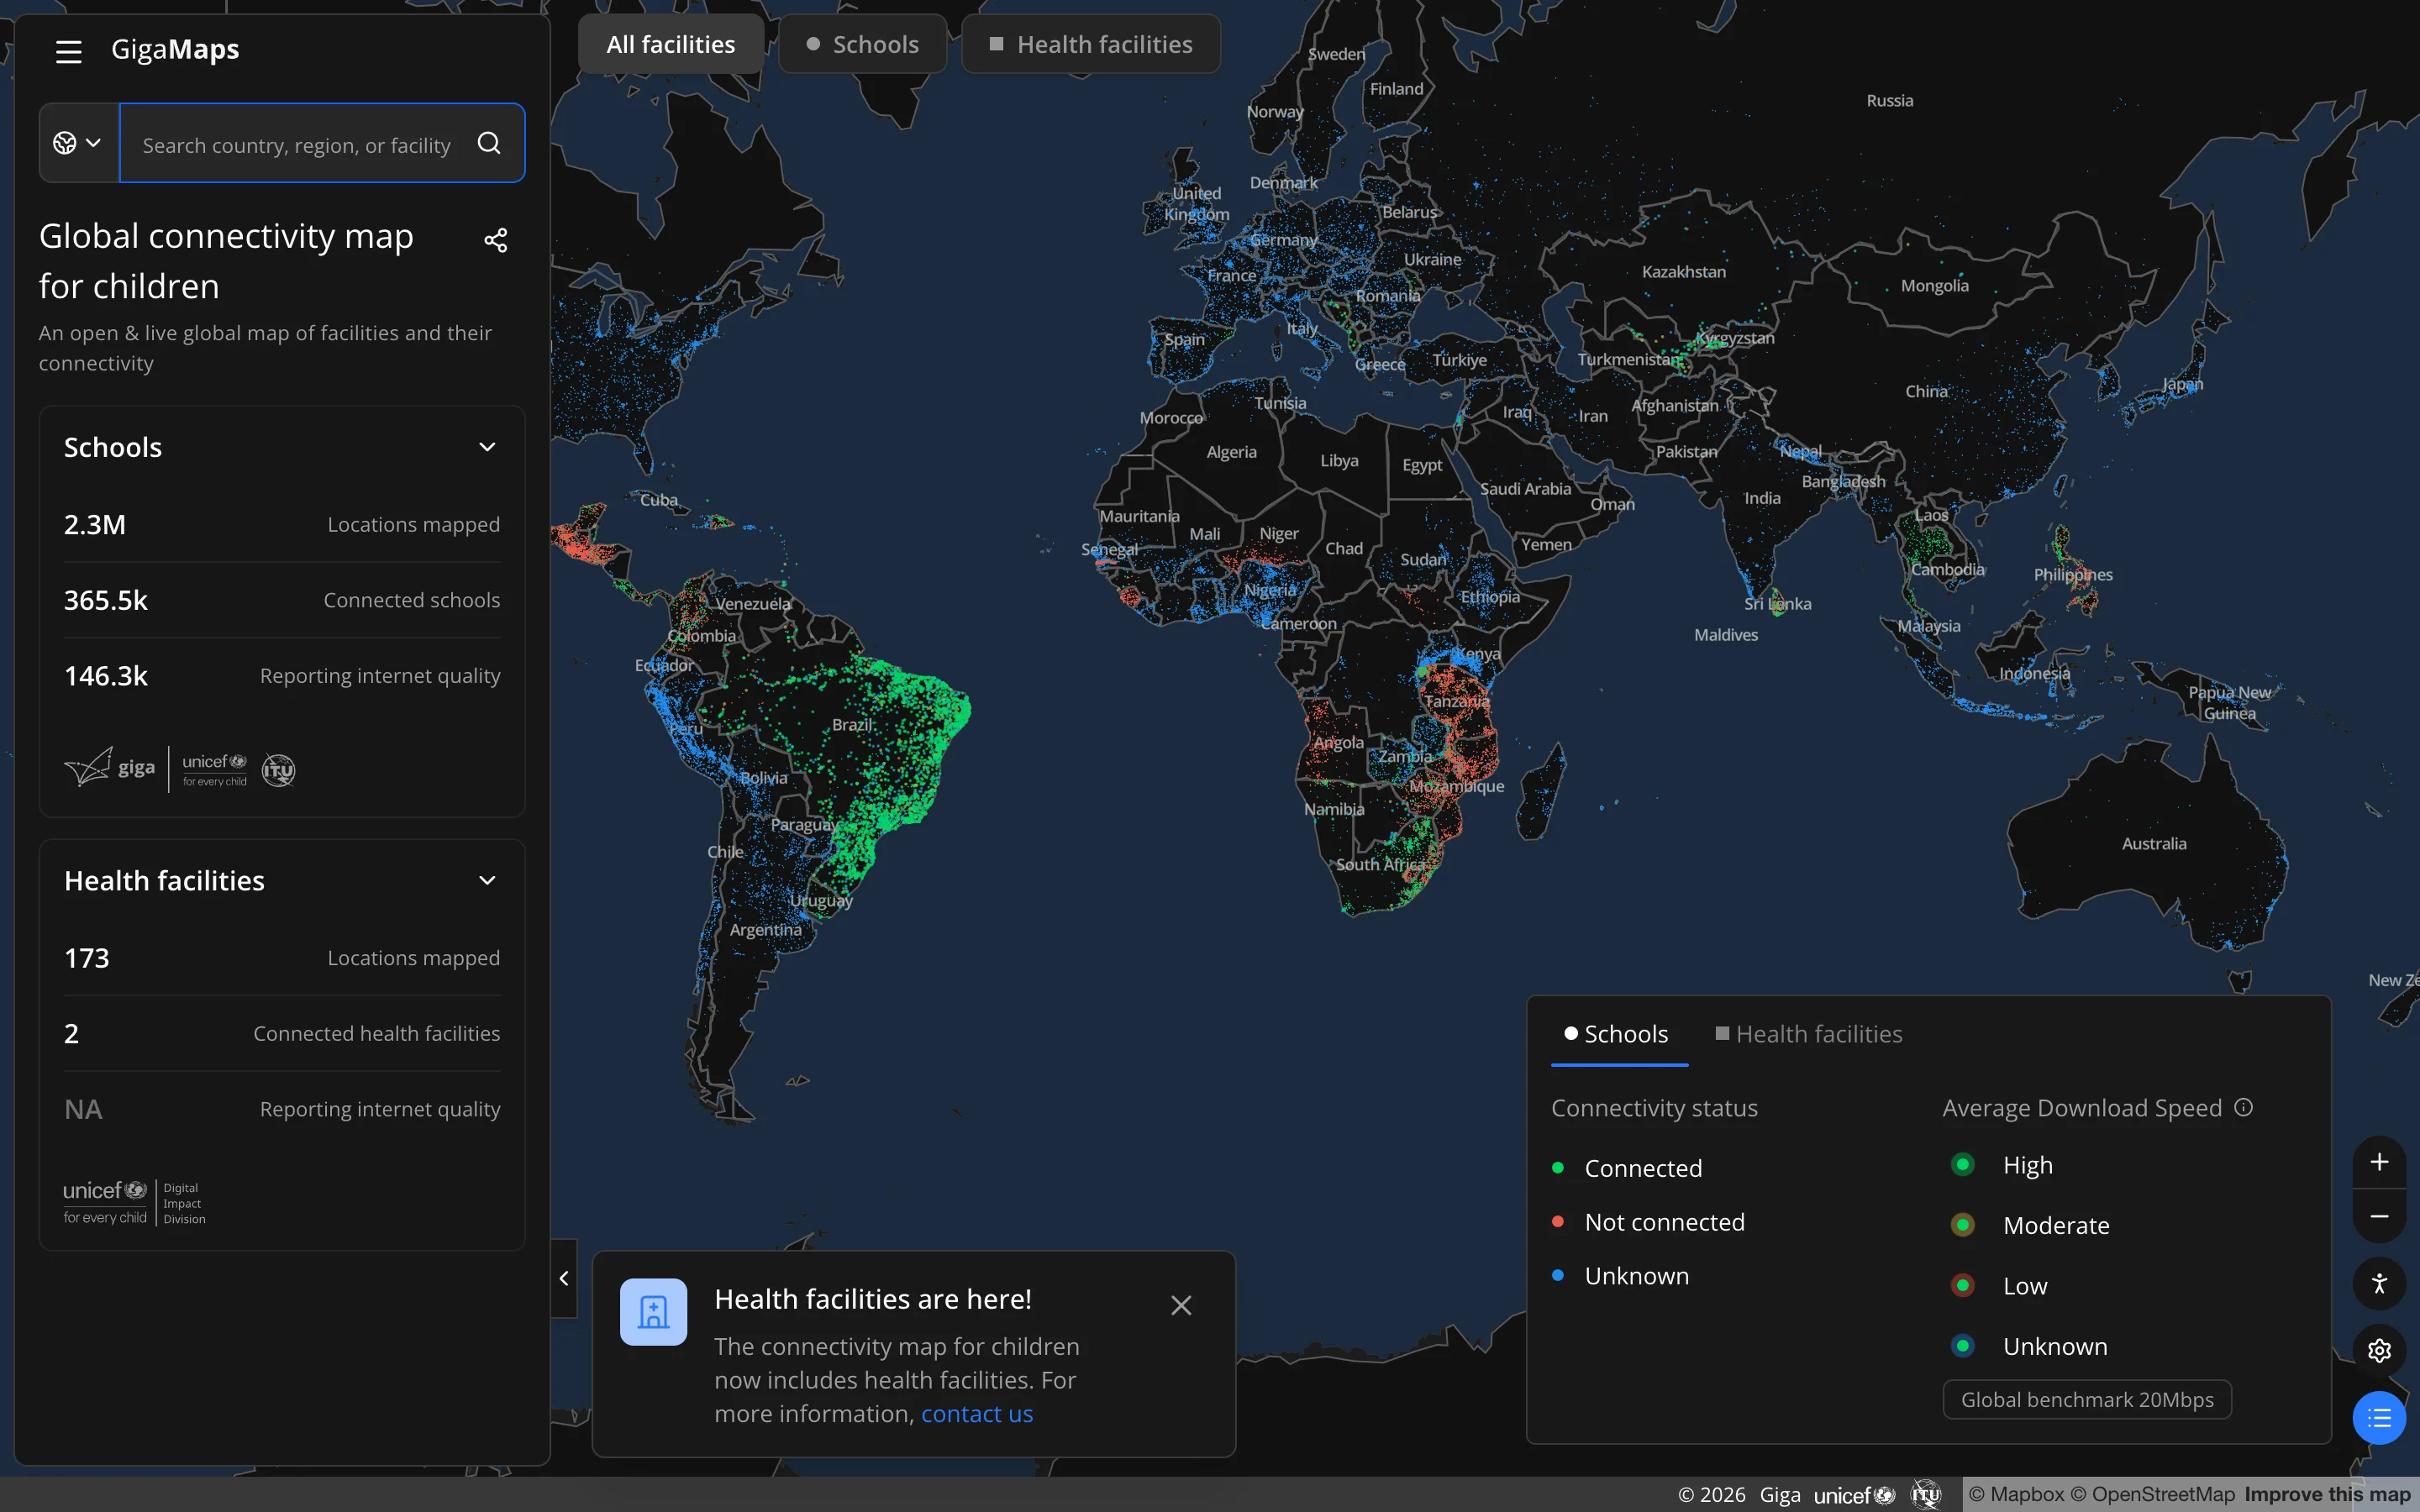
GigaMaps is the flagship product of Giga, the UNICEF and ITU partnership to connect every school to the internet. Governments, partners and colleagues open it to see which schools are connected and how fast.
A map with millions of points is hard to design in Figma alone. A static frame never shows you what happens when a country loads 90 thousand schools in one tile, or how a legend behaves next to a sidebar on a small phone. And every change in production goes through a development cycle, so a wrong idea costs weeks.
I wanted three things: to know what the map should communicate, to test ideas with real people in days, and to send the development team only what was already proven.
Track 1: the research plan
I started from a heuristic evaluation of the whole interface. Then I wrote the research plan, with one guiding question: which domains, data and capabilities make GigaMaps a relevant advocacy tool, today and in two years?
My thesis was that the data on the map is too specific. It speaks at the level of a single school, and there is no general story that shows the connectivity gap at a glance. People who come for a story and people who come for data need different things, and today only the second group is served.
I built the method around four streams of evidence:
- Desk evidence: where the map gets cited, what the analytics say, what other authorities publish.
- Interviews anchored to real decisions. I ask people about the last time they used the map to convince someone, never "would you use X?".
- Artefact tests: think aloud sessions on the live map and on two or three divergent concepts I design myself.
- An internal alignment track, with written prompts about the vision and a workshop.
The second round, in the second half of 2026, focuses on advocacy. Who uses the map to make the case for connectivity, and who could own or fund the platform in the long run? That means fifteen planned interviews across four audiences: development partners, governments and agencies, the private sector and donors, and advocates. I start inside UNICEF and then move outside.
A framework to group the findings
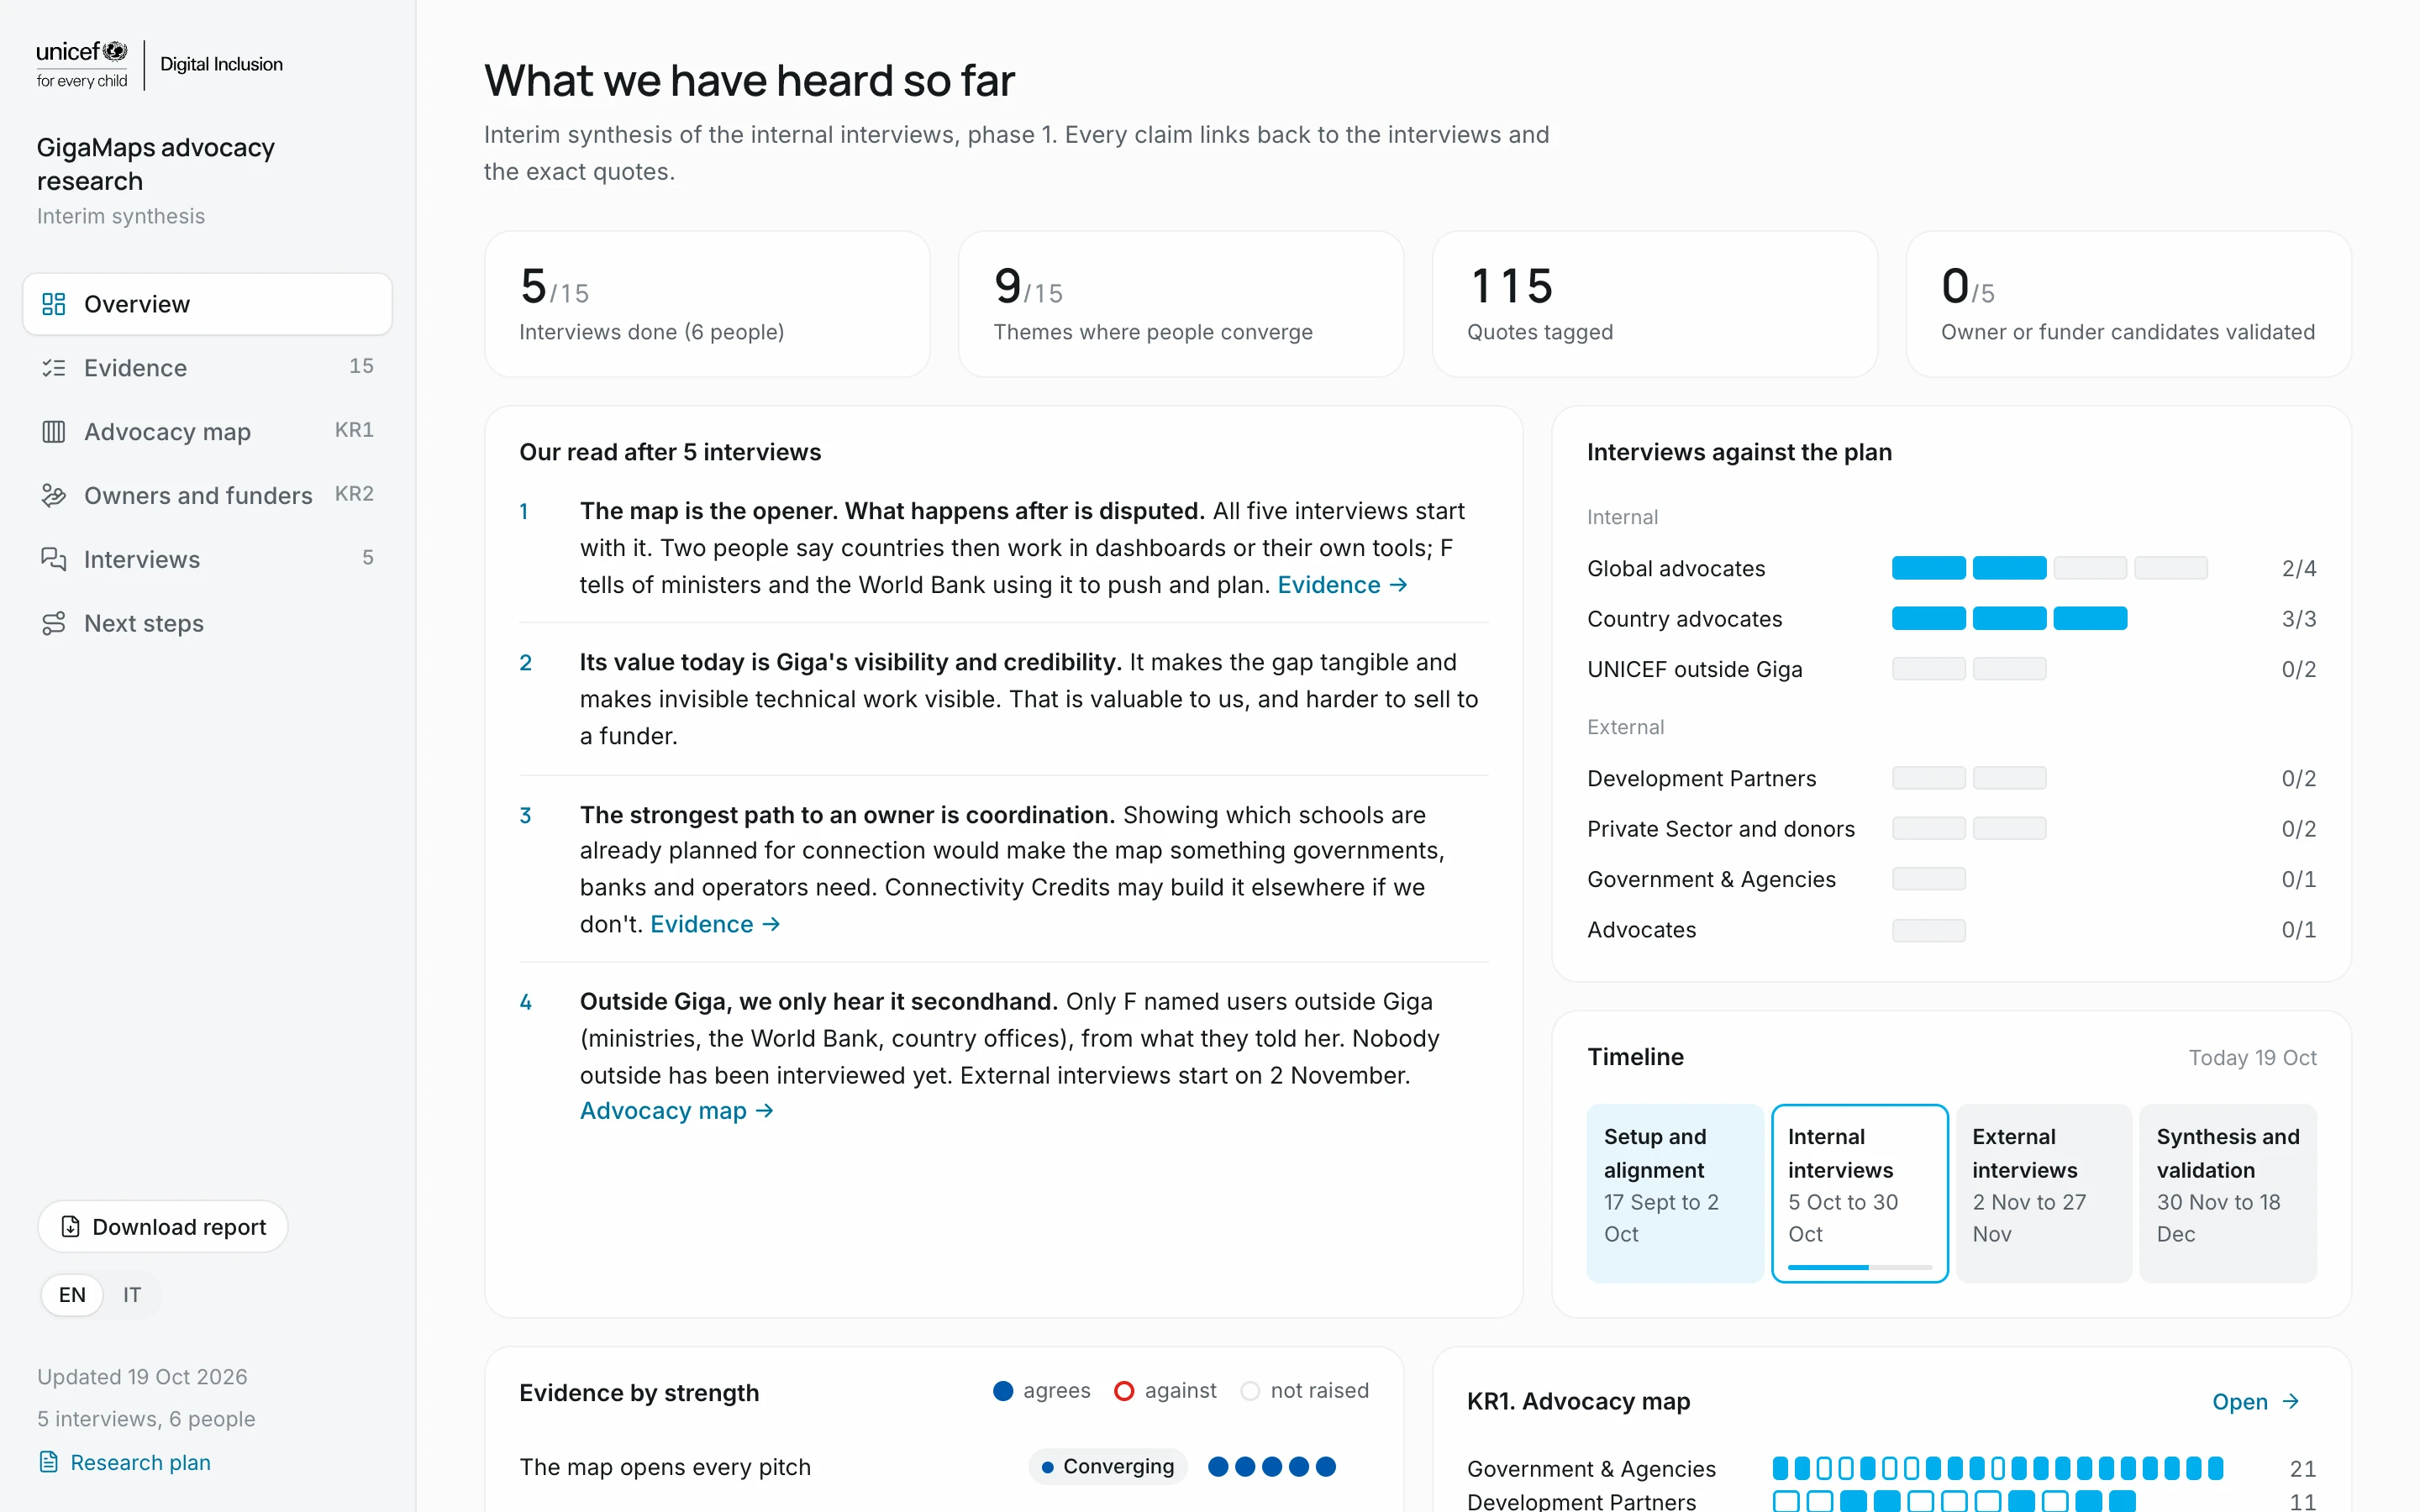
Interviews pile up fast, and a finding that lives in one person's notes is easy to lose or to bend. So I built a framework to group research findings, and a dashboard on top of it.
- Every finding is a claim tied to a research question and to the key result it serves.
- Every interview takes a stance on each claim: it supports it, pushes against it, or agrees in part.
- From the stances, each claim gets a status: converging when most people agree, contested when they don't, thin when it rests on one voice, and a gap when nobody knows.
- Every claim carries its quotes and the next question to ask.
Every quote is checked word for word against the transcript by a script. If it doesn't match, it doesn't go in. The dashboard switches between English and Italian and exports an eleven slide presentation, because nobody reads a long report. A new interview changes one data file, and the whole picture updates.
What the first interviews say
- The map opens every pitch. Its proven job today is the door opener.
- Its value is making the gap and Giga's work visible.
- Advocates compare a country with a peer by hand, and the map has no way to do it yet.
- Who it serves most, Giga or the countries, is contested.
- The strongest path to a long term owner is coordination: showing which schools are already planned for connection.
The external interviews start in November, and the synthesis closes in December.
Track 2: devmap, the prototype
devmap started as a prototype to test new features with new users, before they go into development and into production on GigaMaps. It is a working copy of the map, rebuilt from the Figma file and running on the same data as production.
I built it in code, with Claude Code, so I could own the interface end to end. Some things I only learned by building:
- The data is public but the server sends no CORS headers, so the tiles go through a small proxy.
- The map ran at 1 to 11 frames per second. One tile can carry 90 thousand features, and a glow effect was repainting every frame. I moved to a native circle layer at low zoom and squares only from zoom 10. Now it runs at 59 to 60.
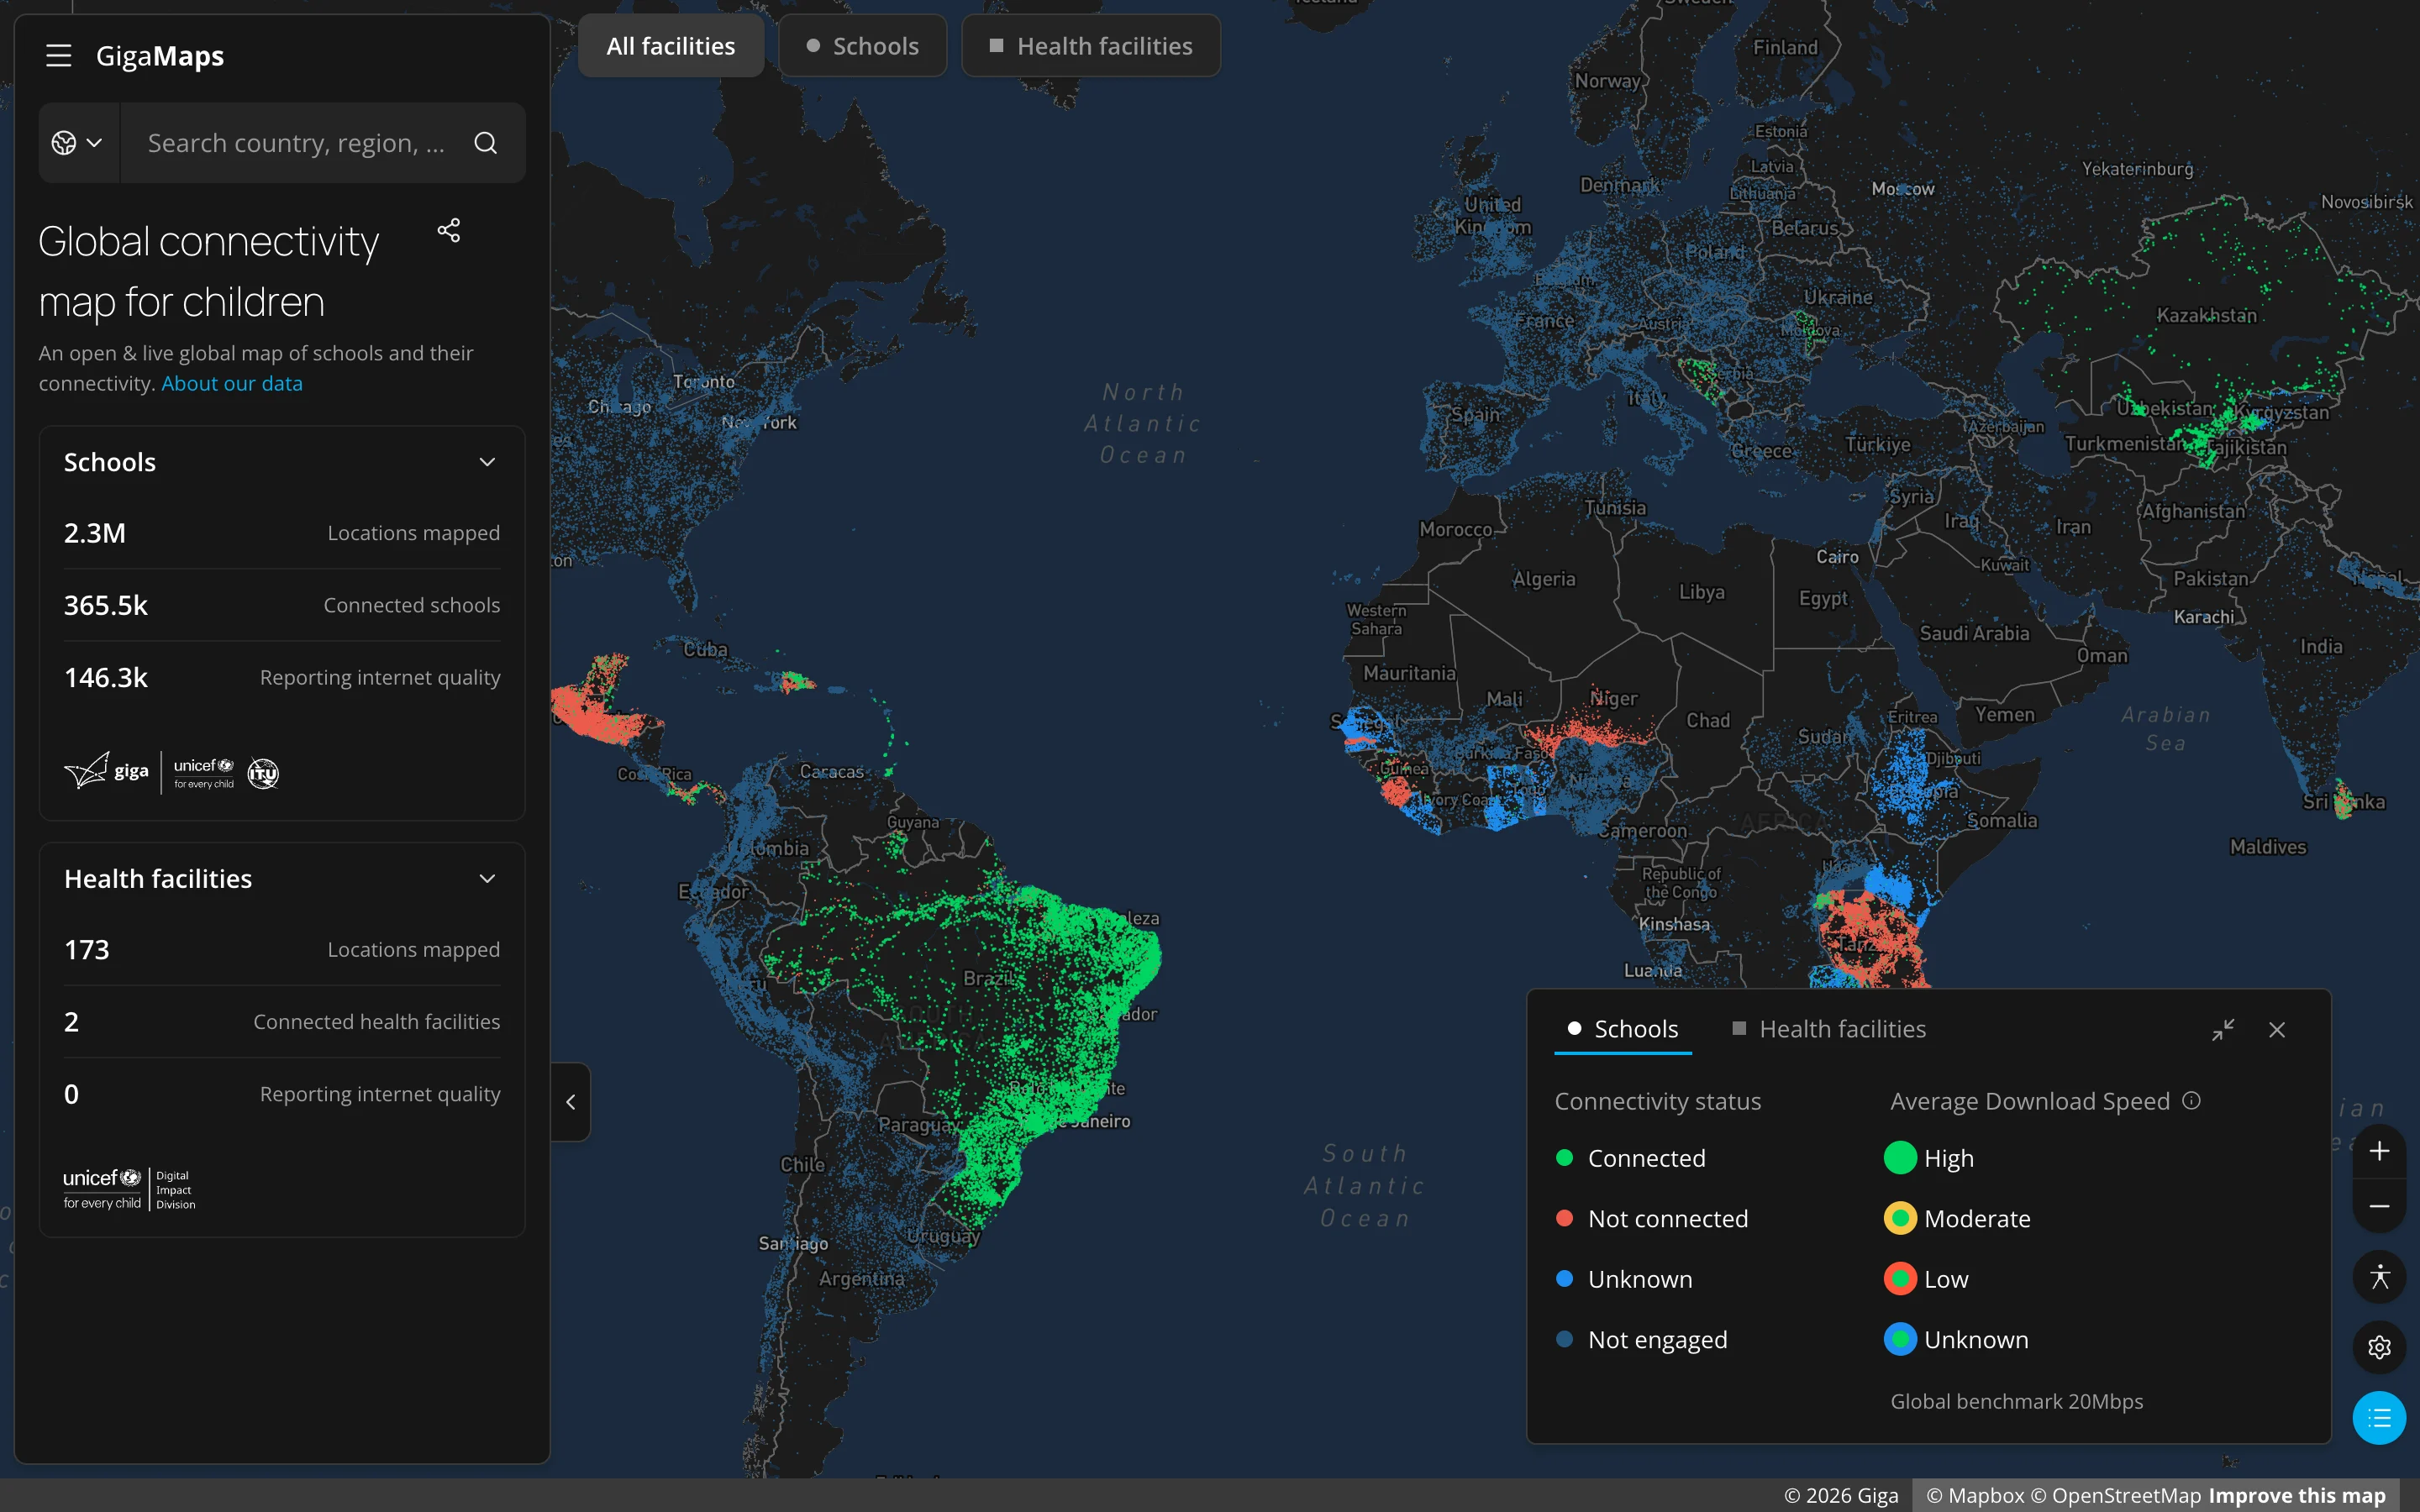
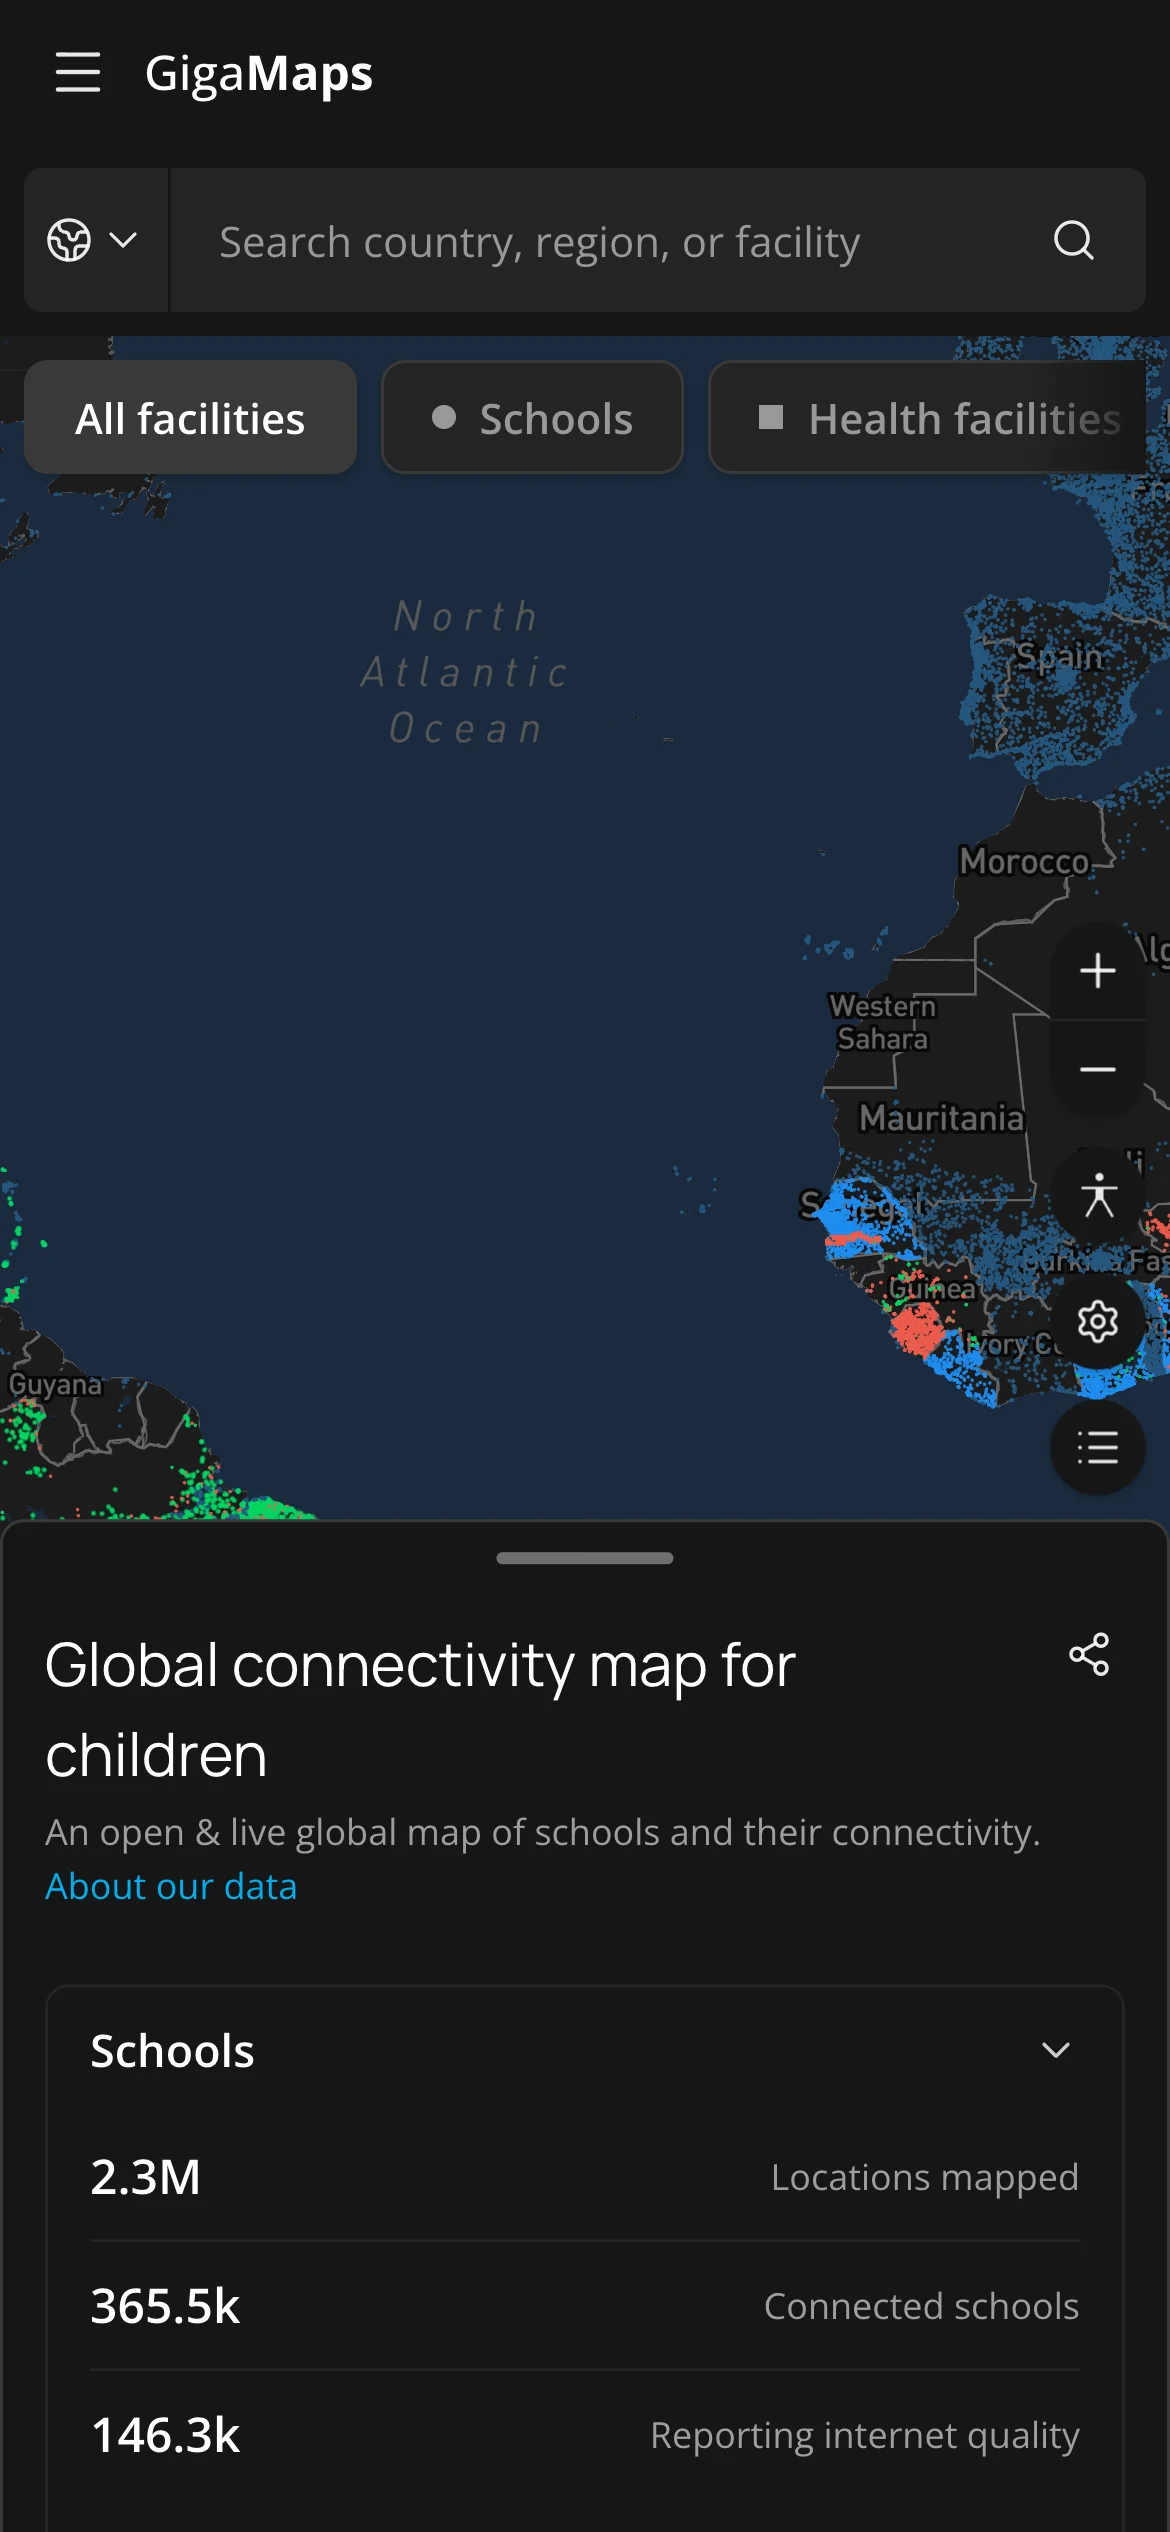
- Health centers joined schools on the map: circles for one, squares for the other.
- Only the 54 countries engaged with Giga keep coloured dots. The tiles don't say which country a point belongs to, so the proxy works it out on the server and tags every point before the map sees it.
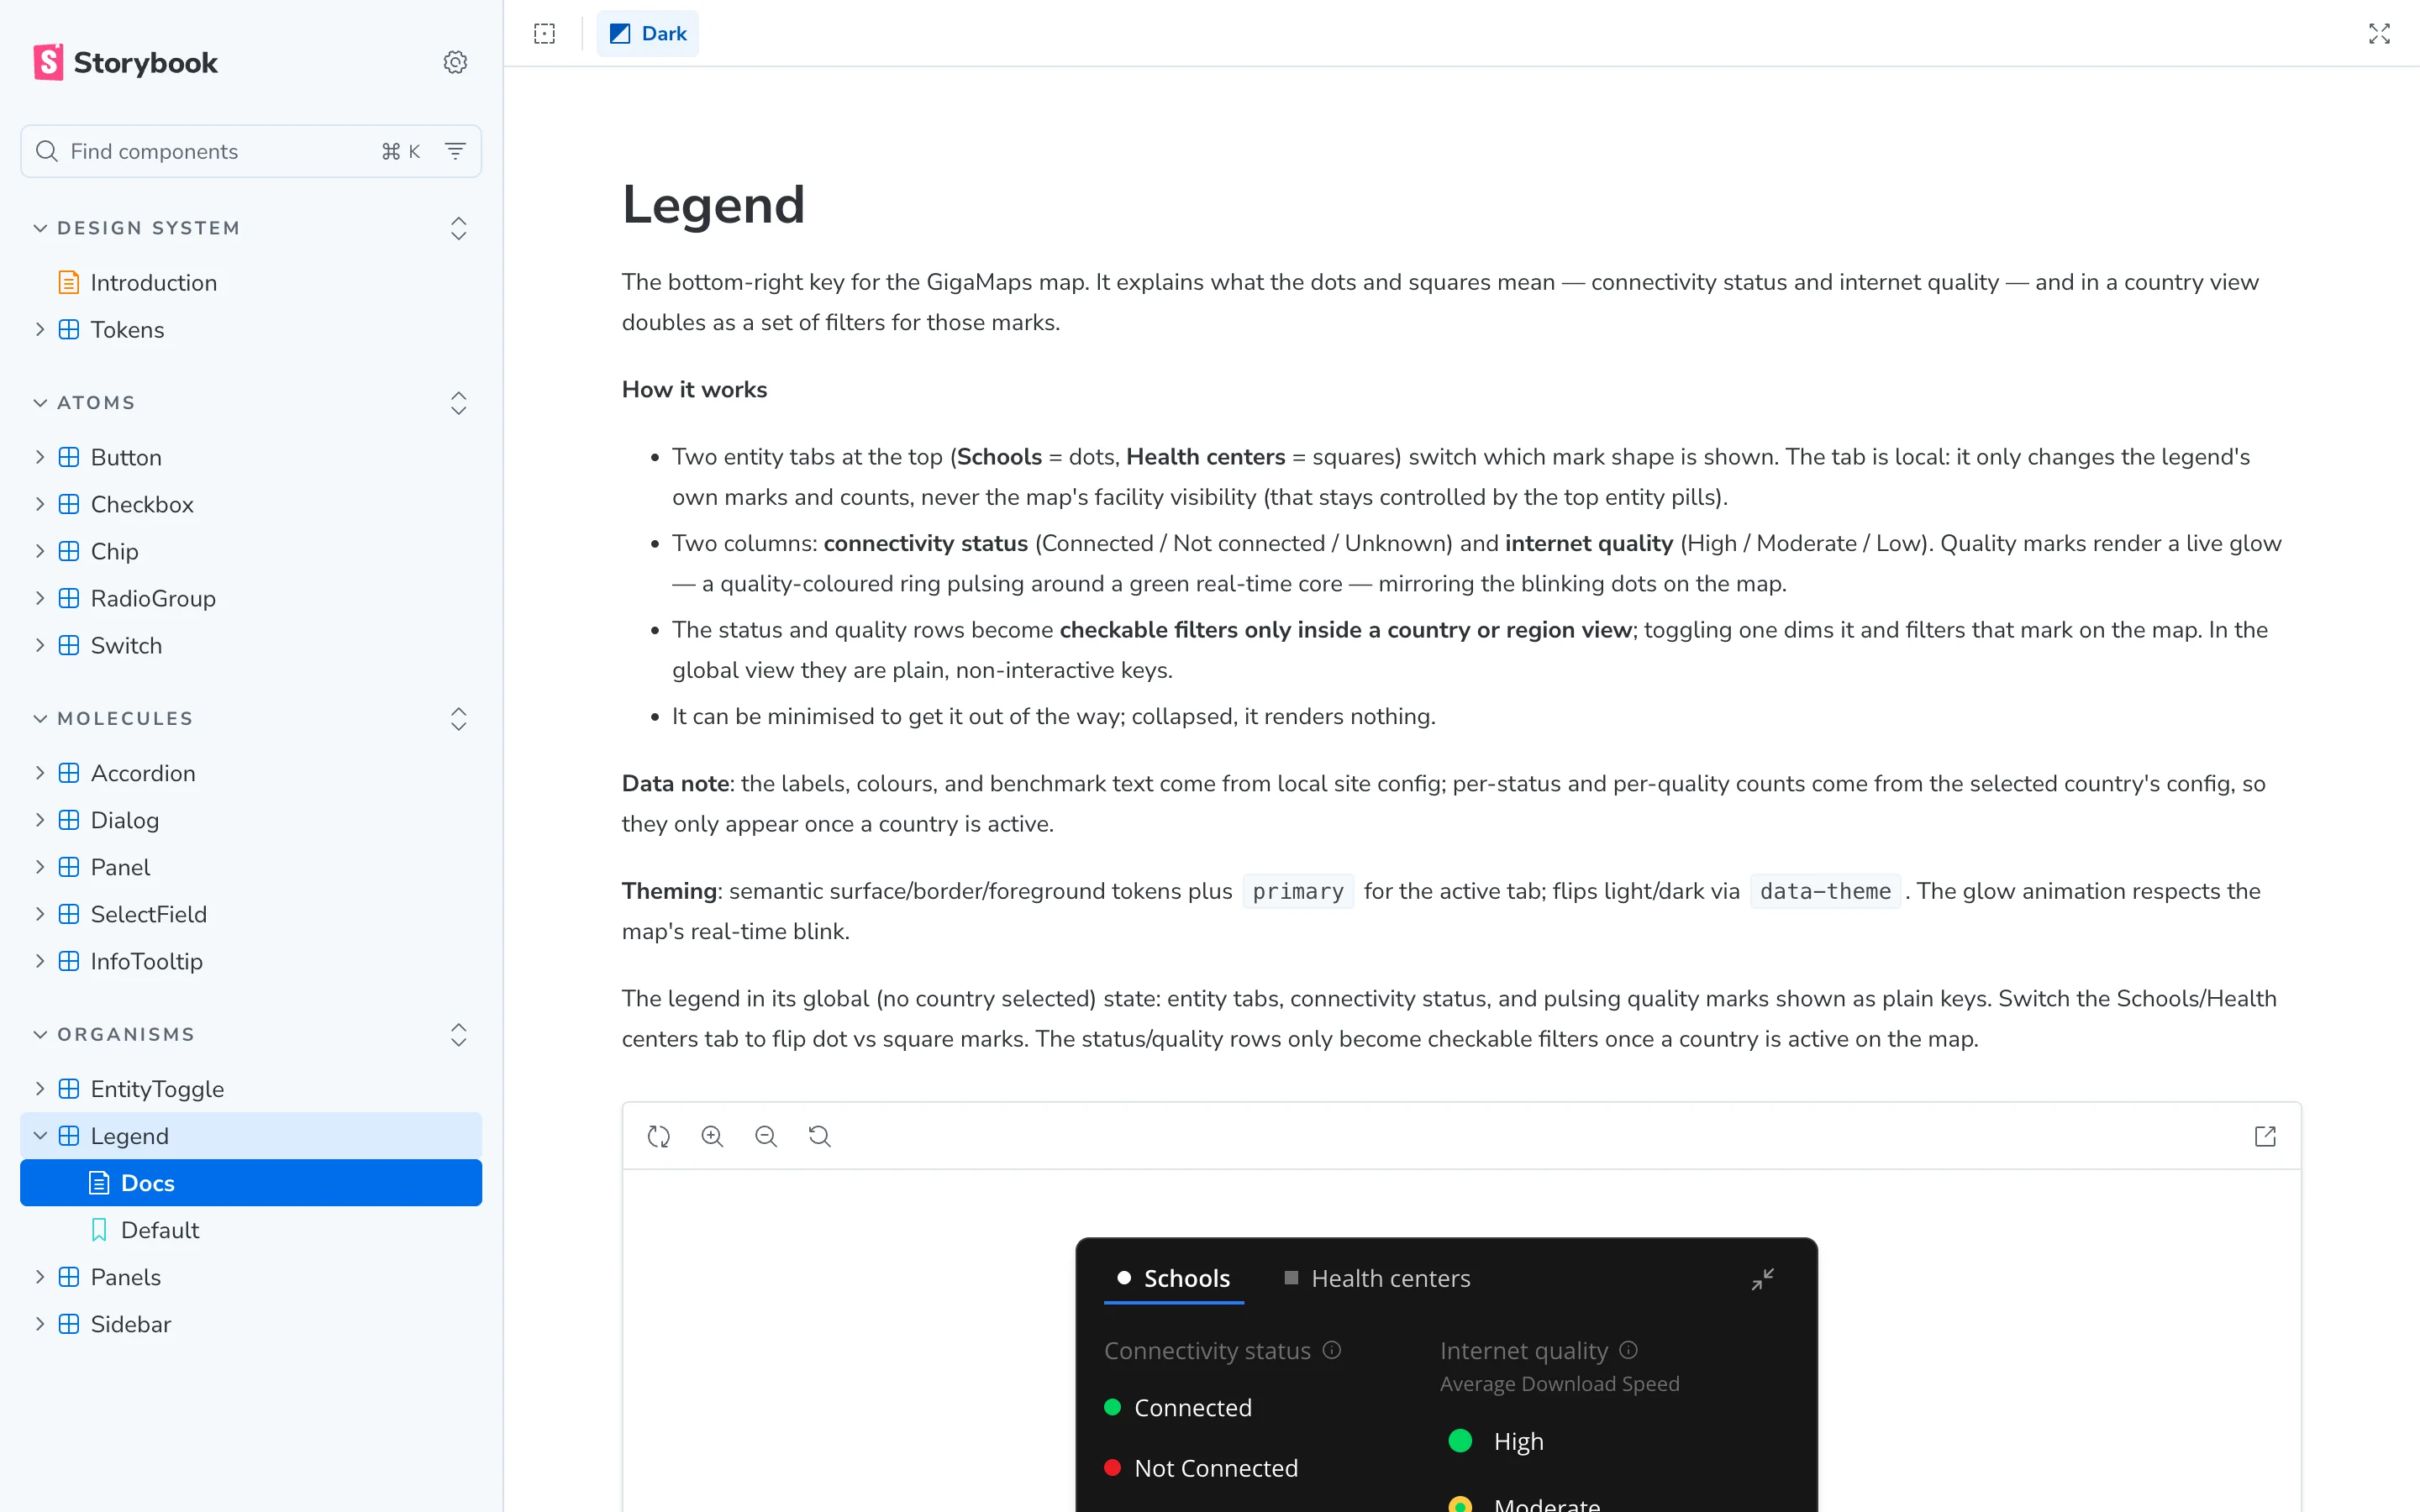
Then I rewrote the components as primitives with semantic tokens, keeping the interface pixel identical. The palette matches the Figma variables one to one, and everything is documented in Storybook. A new Giga product can start from these pieces instead of from zero.
Let's take a look 🗺️
Here is what went through devmap so far:
- Entity cards for schools and health facilities. Collapsed, they show a live download speed. Expanded, they open with a staggered fade. A country with real time data opens its card on landing, and a country without health data shows an empty state with a contact link.
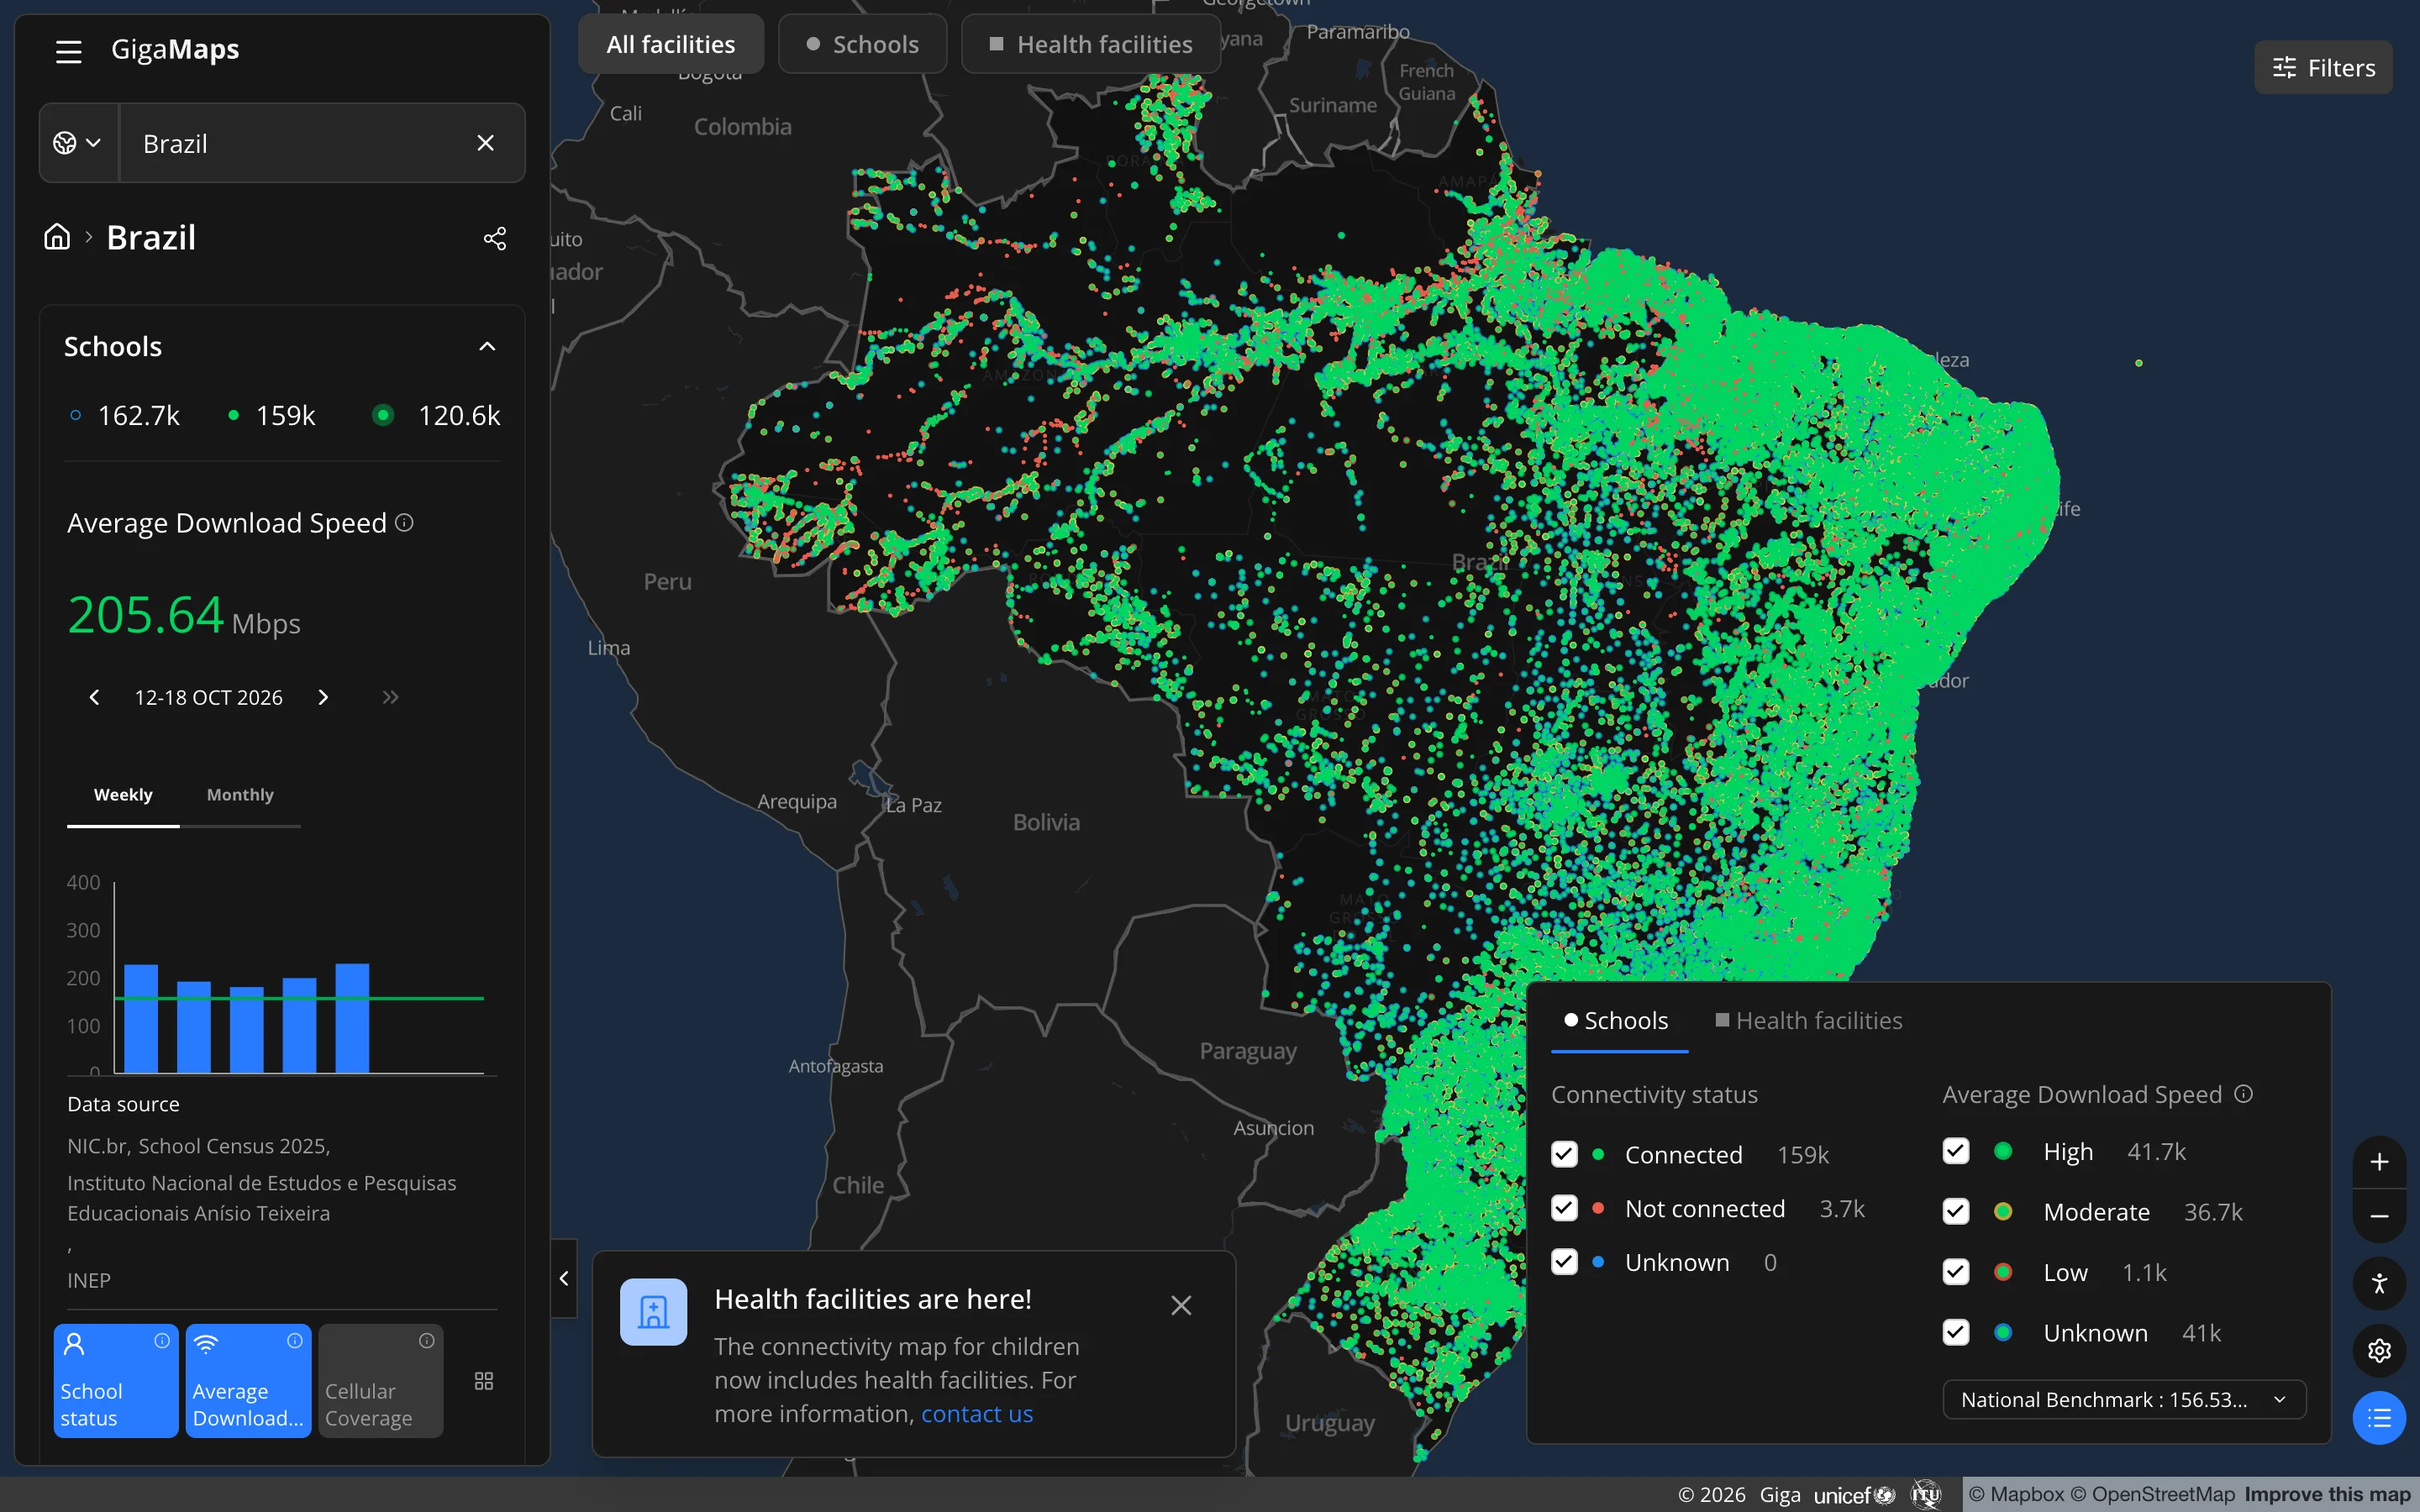
- A legend that never overlaps the sidebar. I compared several options and kept one: a single row on desktop and a switch on mobile. It opens by itself when you land on a country or a school, and once you close it, it stays closed.
- An accessibility mode with a colour blind safe palette in green and magenta, opened from a floating panel instead of a confirm modal.
- A mobile layout with a bottom sheet that snaps in three positions, like the one you know from Google Maps.
- A blue palette built on an OKLCH scale. I tried several font pairings and came back to Manrope for headings and Open Sans for body text.
In October devmap moved from seed data to the production backend. Country figures, speed charts, legend and tiles now come from the same source as maps.giga.global, so a test on devmap is a test on real data.
Track 3: the product
When a feature holds up on devmap, I write it up for the development team with the behaviour I tested, the edge cases and what I learned. The developers start from something that already works, not from a static frame. I also designed Universal Search for GigaMaps: a relevance score built on token matches with a boost by result type, a prototype for stakeholders and a developer build that shows the score live.
Impact
GigaMaps makes the connectivity gap visible. Before you can connect a school, someone has to know where it is, whether it is online and how fast. The map puts that on one screen for governments, partners, donors and the public.
Figures from maps.giga.global, October 2026. Mapped, reporting and connected are three different counts.
Inside UNICEF, the map is where the conversation starts. Country engagement opens onboarding calls with it, the connectivity credits team opens pitches with it, communications puts it in presentations and videos, and the first data request to a government often comes after someone has seen their own country on it. It turns technical work that nobody sees into something people can point at.
Outside, the same view travels. In the countries where colleagues work closely with governments, ministers and development banks use it to push for connectivity, to monitor it and to plan. Health facilities now sit next to schools, so the same map starts to cover more than education.
More screens